How Glycemic Index Is Measured — and Why It Is Misapplied
The glycemic index was developed by David Jenkins and colleagues at the University of Toronto in 1981 as a tool to classify carbohydrate foods by their blood glucose-raising effect, which had been inconsistent and unpredictable using prior classification schemes (simple vs complex carbohydrates). The standardised GI measurement protocol: 10 or more healthy, fasted participants consume a test food containing exactly 50 grams of available (digestible) carbohydrate, and capillary blood glucose is measured at 15–30 minute intervals for 2 hours. The incremental area under the glucose-time curve is expressed as a percentage of the response to 50g pure glucose (the reference food, GI = 100) tested on a separate day.
GI is therefore a measure of carbohydrate quality in isolation — how fast a food raises blood glucose per gram of carbohydrate, under controlled fasting conditions. This creates systematic misunderstanding when GI values are used to guide everyday food choices: a food's GI says nothing about how much carbohydrate it contains per realistic serving, how it behaves in a mixed meal, or how an individual person will respond to it.
The Glycemic Load Correction
Glycemic load (GL) was introduced by Walter Willett at Harvard in 1997 to address the GI serving-size problem. The formula: GL = (GI × grams of available carbohydrate per serving) ÷ 100. This incorporates both the quality (GI) and quantity (grams of carbohydrate per serving) into a single number that better predicts the actual blood glucose impact of eating that portion.
The watermelon example is textbook: GI = 72 (high), but 120g of watermelon contains only 6g available carbohydrate (the rest is water). GL = (72 × 6) / 100 = 4.3 — low. Eating watermelon produces a negligible blood glucose impact per normal serving despite its high GI, because a typical serving contains very little carbohydrate. Avoiding watermelon because of its GI rating is nutritionally counterproductive — it is a highly water-dense, polyphenol-rich food with minimal glycemic impact.
| Food (serving size) | GI | Available carbs (g) | GL | Category |
|---|---|---|---|---|
| Watermelon (120g) | 72 | 6 | 4 | Low GL |
| Carrots, raw (80g) | 47 | 6 | 3 | Low GL |
| Apple (120g) | 38 | 15 | 6 | Low GL |
| Rolled oats, cooked (250g) | 55 | 22 | 13 | Medium GL |
| White pasta, al dente (200g cooked) | 42 | 42 | 18 | Medium GL |
| White rice, boiled (200g cooked) | 70 | 52 | 36 | High GL |
| Baked potato (150g) | 87 | 28 | 24 | High GL |
| White bread (2 slices, 70g) | 73 | 34 | 25 | High GL |
| Cornflakes (30g) | 77 | 26 | 20 | High GL |
| Sweet potato (150g, baked) | 61 | 26 | 16 | Medium GL |
What the table makes clear is that the high-GL entries — white rice (36), white bread (25), baked potato (24), and cornflakes (20) — are all starchy staples typically consumed in large portions with little fiber or protein to slow digestion; the dense carbohydrate load per serving is the shared mechanism. The medium-GL foods — pasta al dente (18), sweet potato (16), and rolled oats (13) — illustrate that cooking method and fiber content exert a meaningful moderating influence even at comparable serving sizes. The practical takeaway is that GL should replace GI as the default index when choosing carbohydrate foods, since it reflects real-world portion sizes rather than a fixed 50g carbohydrate load. Even so, GL becomes secondary to the total dietary context: co-consumed protein, fat, and fiber all slow gastric emptying and reduce the realized glucose impact further, meaning that the most glycemically favorable carbohydrate meals combine moderate-GL foods with adequate protein and fat and at least 10–15g of dietary fiber per meal.
How Food Preparation Changes GI: Resistant Starch
Starch exists in several structural forms with vastly different digestibility. Native starch in raw foods is partially crystalline and is digested slowly by pancreatic amylase; gelatinised starch (after cooking in water) is fully digestible and rapidly raises blood glucose; retrograded starch (formed when cooked starch is cooled) resists amylase and acts as dietary fiber. This last form — resistant starch type 3 (RS3) — is the key variable linking cooking method to GI.
The retrograde resistant starch phenomenon has practical implications that are underutilised in dietary practice. A 2015 study by Burton and Lightowler demonstrated that cooking rice, cooling it overnight at 4°C, and serving it cold or reheated reduced the digestible starch content by ~30% and estimated GI by 10–15 units compared to freshly cooked rice. The same principle applies to potatoes, pasta, and lentils. Cold potato salad, leftover rice, and overnight-chilled pasta all have meaningfully lower glycemic impact than their freshly cooked equivalents — a practical technique requiring no ingredient changes, only meal timing adjustments.
Circadian Glycemia: Time of Day Changes Everything
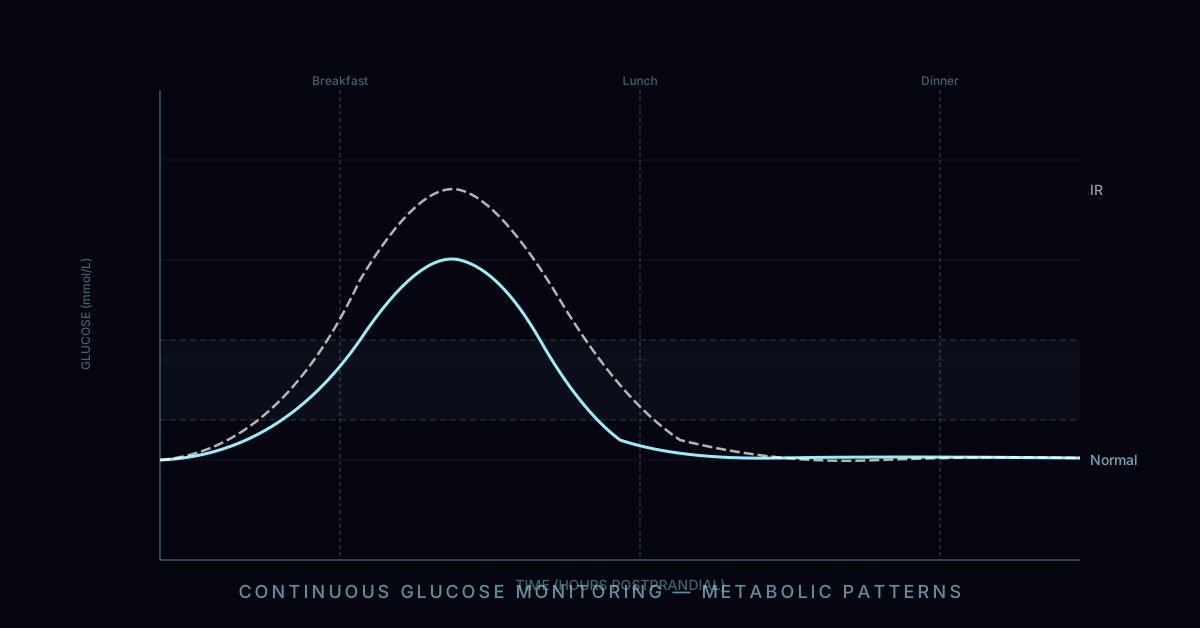
Beyond the properties of food itself, the time of day at which a given food is consumed substantially alters its glycemic impact — a phenomenon grounded in the circadian physiology of glucose metabolism. Insulin sensitivity in skeletal muscle and the liver follows a robust circadian rhythm, peaking in the morning (approximately 07:00–11:00 in people with typical sleep-wake cycles) and declining through the afternoon to reach a nadir in the late evening.
A 2015 study by Morris et al. (Proceedings of the National Academy of Sciences) demonstrated this directly: identical meals consumed at the circadian equivalent of 3 AM produced significantly higher postprandial glucose, insulin, and triglycerides compared to the same meals consumed in the morning — even in healthy volunteers with no metabolic disease. This circadian effect on glucose tolerance means that a food with a given GL produces a larger blood glucose excursion in the evening than in the morning. Practically: the same bowl of pasta that produces a modest glucose response at lunch may produce a high-glycemic response at 20:00, because the circadian clock has reduced pancreatic insulin secretion capacity and peripheral glucose disposal capacity.
The HOMA-IR context: the glycemic impact of any food is also modulated by the individual's degree of insulin resistance (quantified by HOMA-IR = fasting insulin × fasting glucose ÷ 22.5). In insulin-resistant individuals, glucose disposal is impaired across the board, magnifying the glycemic impact of all carbohydrate foods and lowering the practical threshold below which GL is clinically safe.
Personal Glycemia: Why Your CGM Overrides GI Tables
The 2015 Weizmann Institute personalised nutrition study (Zeevi, Segal, Elinav et al., Cell) fundamentally changed the scientific understanding of glycemic response. Continuous glucose monitors in 800 participants revealed that different people had completely different glycemic responses to identical standardised foods — in some cases the person with the highest response to a food and the person with the lowest response were consuming the same food from the same batch.
Microbiome composition was the strongest individual predictor of glycemic response variation, outperforming genetic factors, explaining ~30% of the variance in postprandial glucose. The study's intervention arm showed that personalised dietary advice based on predicted individual glycemic responses (using a machine learning algorithm trained on microbiome composition, physical activity, blood parameters, and prior eating patterns) reduced postprandial glucose excursions significantly compared to expert-recommended diets. This remains the only trial demonstrating that microbiome-based personalised nutrition outperforms standard dietary guidance on glycemic outcomes, though its short duration (1 week) limits long-term extrapolation.
For individuals motivated to optimise their carbohydrate choices for blood sugar management, 2–4 weeks of CGM use provides irreplaceable personal data: it identifies which specific foods produce unexpectedly high spikes in that individual's context, the magnitude of the circadian effect on personal glucose responses, and how exercise timing, sleep quality, and meal composition modify individual glycemic responses to familiar foods.