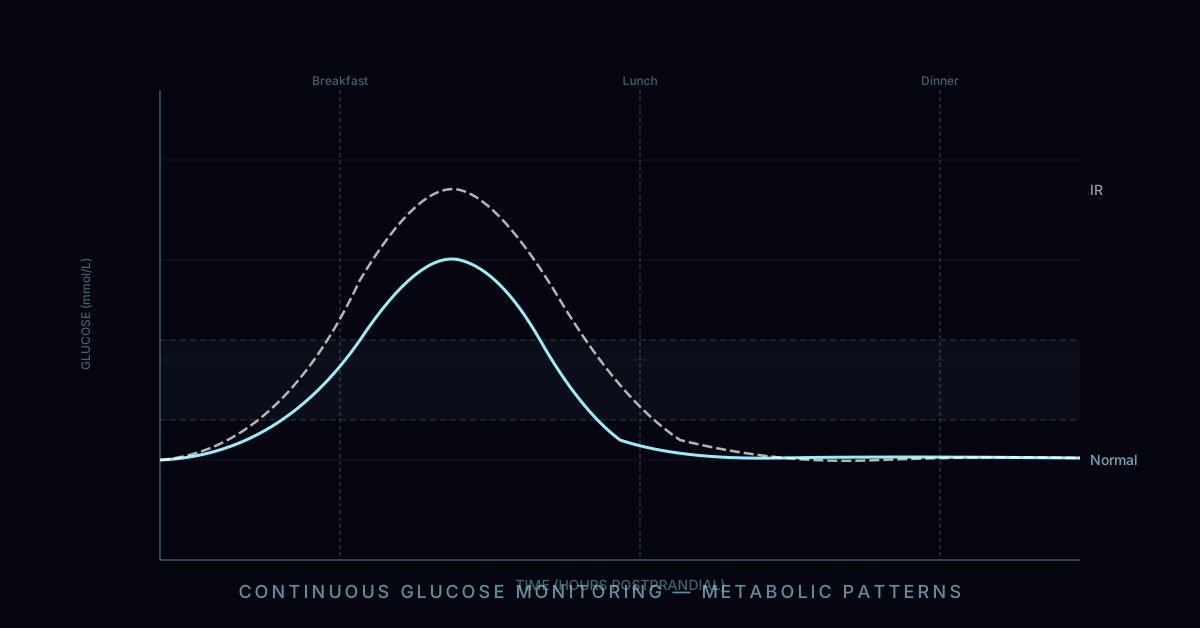
In the typical progression toward type 2 diabetes, there is a long, silent prologue lasting a decade or more. Fasting glucose sits comfortably in the normal range. HbA1c shows nothing alarming. The standard metabolic panel is unremarkable. And yet, beneath the surface, the pancreas is working significantly harder than it should — pouring out two, three, or five times the normal amount of insulin just to keep blood sugar from rising. The cells have become resistant. The compensatory mechanism is humming at full throttle. And none of this appears on a standard blood test.
HOMA-IR — the Homeostatic Model Assessment of Insulin Resistance — makes this invisible process visible. Using nothing more than a fasting glucose and a fasting insulin, it produces a single number that reflects the degree to which insulin resistance has taken hold. It is simple, cheap, and among the most clinically informative metabolic tests available. The frustrating reality is that fasting insulin — the only component not on a standard metabolic panel — is almost never ordered by default.
This article explains what HOMA-IR measures, what the numbers mean, what disease it predicts, and — most practically — what lowers it.
The HOMA-IR Formula and Its Logic
HOMA-IR was developed in 1985 by Matthews, Hosker, and colleagues at the Oxford Centre for Diabetes as a practical alternative to the hyperinsulinaemic euglycaemic clamp — the gold standard for measuring insulin sensitivity but far too complex and invasive for clinical use.
The formula is:
HOMA-IR = (Fasting Glucose [mg/dL] × Fasting Insulin [µIU/mL]) ÷ 405
In SI units: HOMA-IR = (Fasting Glucose [mmol/L] × Fasting Insulin [µIU/mL]) ÷ 22.5
The logic is grounded in endocrinology. In a state of normal insulin sensitivity, the pancreas produces a modest basal insulin level (typically 3–8 µIU/mL fasting) sufficient to maintain fasting glucose in the 70–90 mg/dL range. The product of these two values — divided by the calibration constant — produces a HOMA-IR close to 1.0.
As insulin resistance develops, cells in skeletal muscle, liver, and adipose tissue respond less effectively to insulin signalling. To maintain the same fasting glucose level, the pancreas must secrete more insulin. This compensatory hyperinsulinaemia keeps glucose normal — for a while — but the elevated fasting insulin drives HOMA-IR upward even before glucose rises into the prediabetic range. This is the window that HOMA-IR captures and that standard glucose testing misses entirely.
Interpreting Your HOMA-IR Number
| HOMA-IR Value | Interpretation | Clinical Significance |
|---|---|---|
| < 1.0 | Optimal insulin sensitivity | Characteristic of lean, active, metabolically healthy adults |
| 1.0 – 2.0 | Borderline / early insulin resistance | Pancreas beginning to compensate; early visceral fat accumulation likely |
| 2.0 – 2.9 | Clinically significant insulin resistance | Associated with metabolic syndrome, NAFLD, PCOS; intervention recommended |
| 3.0 – 5.0 | Moderate-severe insulin resistance | High risk of prediabetes; strongly associated with cardiovascular risk |
| > 5.0 | Severe insulin resistance | Common in overt T2D; also occurs in severe obesity with normal glucose |
For clinical context: the mean HOMA-IR in large European and US population studies of non-diabetic adults ranges from 1.7 to 2.2, with the 75th percentile at approximately 2.5–2.8. This means that by the stricter preventive medicine standard of below 1.0 as optimal, a large proportion of the population is already metabolically compromised — they simply do not know it because fasting insulin is not on their standard labs.
The Missing Test: Why Fasting Insulin Is Not on Standard Labs
The absence of fasting insulin from the standard metabolic panel is one of the more consequential gaps in modern preventive medicine. Understanding why it is missing helps clarify both the systemic problem and the personal action you can take.
The standard metabolic panel was codified in the mid-twentieth century when insulin assays were expensive, technically demanding, and not standardised across laboratories. Fasting glucose was cheap, universally available, and directly diagnostic for diabetes at the extreme end. It was adopted as the standard. By the time insulin immunoassays became cheap and standardised, the panel was established, and institutional inertia — in laboratories, insurers, and medical education — kept fasting insulin off it.
There is also a deeper structural issue: the clinical system is largely organised around treating overt disease, not optimising health before disease develops. The diagnosis of prediabetes requires glucose above 100 mg/dL fasting or HbA1c above 5.7%. Below those thresholds, standard testing offers no differentiation — a person with HOMA-IR 1.0 and a person with HOMA-IR 4.5 receive identical reporting on their standard labs. This is not a clinically defensible distinction to ignore.
The functional and preventive medicine communities have identified this gap and increasingly include fasting insulin as a standard measurement. The growing awareness of insulin resistance as a root cause of metabolic syndrome, cardiovascular disease, NAFLD, and possibly cognitive decline is pushing fasting insulin — and HOMA-IR — into broader clinical use.
The Insulin Resistance Spectrum: From Hyperinsulinaemia to T2D
Insulin resistance does not jump from normal to diabetic. It progresses along a spectrum over years or decades, and HOMA-IR maps to this spectrum with remarkable granularity.
Stage 1 — Compensated insulin resistance: Cells become insulin resistant (particularly skeletal muscle, the primary site of glucose disposal). The pancreas responds by producing more insulin. Fasting glucose remains normal (below 100 mg/dL), but fasting insulin is elevated (above 10–12 µIU/mL). HOMA-IR is elevated (above 2.0). The person feels fine and their standard labs are completely normal. This stage can persist for 5–15 years.
Stage 2 — Prediabetes: The beta cells can no longer fully compensate. Fasting glucose rises above 100 mg/dL (impaired fasting glucose). Postprandial glucose spikes become prolonged. HbA1c begins to rise above 5.7%. HOMA-IR is typically 3.0–6.0. This stage is diagnosable by current guidelines — but had fasting insulin been measured earlier, the underlying process was visible a decade ago.
Stage 3 — Type 2 diabetes: Beta cell exhaustion leads to inadequate insulin secretion for the degree of resistance. Fasting glucose exceeds 126 mg/dL or HbA1c exceeds 6.5%. HOMA-IR may be very high (above 5.0) or paradoxically moderate if beta cell failure is significant. At this stage, the disease is overt and the window for reversal is narrowing.
HOMA-IR is the tool that sees Stage 1 — the most actionable and reversible point on this spectrum. Standard testing only becomes diagnostic at Stage 2 or 3.
What Does Elevated HOMA-IR Predict?
The clinical consequences of insulin resistance extend far beyond diabetes risk. Elevated HOMA-IR is an independent predictor of a remarkably broad range of conditions:
Non-alcoholic fatty liver disease (NAFLD/MASLD) is almost universally driven by hepatic insulin resistance. When the liver becomes resistant to insulin, suppression of gluconeogenesis and de novo lipogenesis fails — leading to excess hepatic fat accumulation. HOMA-IR above 2.5 detects NAFLD in non-diabetic adults with approximately 70–75% sensitivity in validated studies.
Polycystic ovary syndrome (PCOS) has insulin resistance as a core pathophysiological driver in 65–80% of affected women, regardless of BMI. Elevated insulin drives ovarian theca cell androgen production (particularly testosterone), impairs follicle development, and causes the hyperandrogenism and anovulation characteristic of PCOS.
Cardiovascular disease risk is substantially elevated by insulin resistance through multiple mechanisms: endothelial dysfunction, increased VLDL and triglyceride production, reduced HDL, sodium retention, sympathetic nervous system activation, and procoagulant effects.
Hypertension is tightly linked to insulin resistance. Elevated insulin impairs renal sodium excretion, activates the sympathetic nervous system, and reduces endothelial nitric oxide production — all of which raise blood pressure.
Cancer risk is elevated in insulin-resistant individuals across multiple tumour types (breast, colorectal, endometrial, pancreatic) through the mitogenic and anti-apoptotic effects of elevated insulin and IGF-1.
Cognitive decline has an increasingly recognised link to insulin resistance. The brain is an insulin-sensitive organ, and cerebral insulin resistance impairs glucose metabolism and synaptic function. Some researchers describe Alzheimer's disease as a form of cerebral insulin resistance ('type 3 diabetes').
How to Lower HOMA-IR: The Evidence Hierarchy
HOMA-IR is one of the most modifiable biomarkers in clinical medicine — far more responsive to intervention than LDL-C or blood pressure. The interventions below are ranked by the strength of evidence and magnitude of effect:
1. Zone 2 Aerobic Exercise is the single most potent intervention for improving insulin sensitivity per unit time. Zone 2 exercise (moderate-intensity sustained effort at approximately 60–70% of maximum heart rate — a pace at which you can hold a conversation but with some effort) performed 3–5 sessions per week for 45–60 minutes drives adaptations in skeletal muscle that are directly relevant to insulin sensitivity: increased mitochondrial density, increased GLUT4 transporter expression and translocation, improved fatty acid oxidation capacity, and reduced intramuscular lipid accumulation. Studies consistently show HOMA-IR reductions of 20–35% after 8–12 weeks of consistent Zone 2 training.
2. Resistance Training increases skeletal muscle mass — the body's primary site of insulin-stimulated glucose disposal. Each additional kilogram of lean muscle mass meaningfully improves the capacity to clear glucose from the bloodstream. Two to four resistance training sessions per week combining compound movements (squat, deadlift, press, row) with progressive overload produces significant HOMA-IR improvement within 8–16 weeks, additive to Zone 2 effects.
3. Time-Restricted Eating (TRE) compresses the eating window to 8–10 hours per day, reducing the number of hours per day during which the pancreas is stimulated to produce insulin. This reduces the total daily insulin area under the curve, allows for longer periods of low insulin that support fat oxidation and insulin receptor upregulation, and aligns eating with circadian metabolic rhythms. Studies show HOMA-IR reductions of 10–25% with TRE alone, most pronounced in insulin-resistant individuals.
4. Dietary Carbohydrate Reduction lowers the postprandial glucose and insulin spikes that, over time, drive insulin receptor downregulation and worsening resistance. A low-carbohydrate or ketogenic diet can reduce fasting insulin dramatically — by 40–60% in severely insulin-resistant individuals — by eliminating the primary driver of insulin secretion.
5. Sleep Optimisation is underappreciated as a HOMA-IR intervention. A single night of sleep restriction to under 6 hours increases HOMA-IR by 20–25% acutely — demonstrating that insulin sensitivity is intimately regulated by sleep. Chronic sleep restriction is a significant independent driver of insulin resistance. Targeting 7–9 hours of sleep, with consistent bed and wake times, is among the most powerful interventions for maintaining insulin sensitivity.
6. Visceral Fat Reduction — achieved through any combination of the above — directly reduces hepatic insulin resistance. Visceral adipose tissue is metabolically active, releasing pro-inflammatory cytokines (TNF-α, IL-6, resistin) that directly impair insulin signalling in liver and muscle. Each percentage point of visceral fat reduction produces meaningful HOMA-IR improvement.
7. Pharmacological Interventions include metformin (reduces hepatic glucose production and modestly improves peripheral insulin sensitivity, HOMA-IR reduction 10–20%), berberine (comparable mechanism and efficacy to metformin, available OTC), and GLP-1 receptor agonists (semaglutide, tirzepatide — the most potent pharmacological tools available for insulin resistance, HOMA-IR reductions of 40–60% at therapeutic doses).
How Quickly Does HOMA-IR Respond?
One of the most motivating aspects of HOMA-IR as a clinical target is the speed of response. Unlike some biomarkers that take months to shift, HOMA-IR can change meaningfully within 2–4 weeks of consistent intervention. This makes it an excellent feedback tool — retesting at 8–12 weeks after starting Zone 2 exercise and dietary changes provides concrete, objective evidence of progress before any meaningful change in body weight or HbA1c might be visible.
For patients who are newly diagnosed with insulin resistance, documenting a HOMA-IR reduction from, say, 3.5 to 1.8 within 10 weeks of lifestyle change is often profoundly motivating — it demonstrates in direct biochemical terms that the intervention is working at the cellular level.
Beyond HOMA-IR: The Kraft Insulin Assay
HOMA-IR is an excellent screening tool, but it only captures the fasting state. For deeper characterisation of glucose and insulin metabolism, the Kraft insulin assay — developed by Dr. Joseph Kraft in the 1970s from analysis of over 15,000 patients — measures insulin at multiple time points (0, 30, 60, 120, and 180 minutes) during a glucose tolerance test. This provides a complete picture of insulin secretion dynamics: first-phase and second-phase responses, peak timing, and prolonged hyperinsulinaemia after glucose load — all of which are abnormal in different patterns of insulin resistance that HOMA-IR alone cannot distinguish. For patients with normal HOMA-IR but clinical suspicion of insulin dysregulation, or for those wanting comprehensive metabolic phenotyping, the Kraft assay offers significantly more information. It is available through specialised functional medicine labs and some academic centers.
Clinically, the Kraft assay is most warranted in patients with a strong family history of type 2 diabetes, a personal history of gestational diabetes, PCOS with normal HOMA-IR, or unexplained fatigue and metabolic symptoms despite fasting labs that fall within the normal range. The five Kraft insulin response patterns — ranging from Type 1 (normal secretion and timing) through Type 5 (delayed and blunted response consistent with beta cell exhaustion) — reveal whether the primary dysfunction is early hyperinsulinaemia with normal glucose disposal, delayed insulin response, or failure to suppress insulin return to baseline, each with distinct clinical implications for intervention. In practice, the 5-sample Kraft protocol is available at only a small number of specialty labs outside academic centers, making it inaccessible to most patients. A more accessible middle ground is a 2-hour 75g oral glucose tolerance test (OGTT) with insulin measurements drawn at 0, 30, 60, and 120 minutes — this 4-point abbreviated protocol captures the most clinically relevant Kraft patterns (particularly the early hyperinsulinaemia of Type 2 and the delayed peak of Type 3) and can be ordered through any lab that performs insulin assays alongside standard glucose tolerance testing.
The Bottom Line
HOMA-IR is one of the most clinically valuable metabolic tests available — simple, cheap, and capable of detecting the most prevalent chronic disease precursor in industrial societies a decade before standard testing raises a flag. The only barrier is requesting fasting insulin alongside your standard labs.
If your HOMA-IR is above 2.0, you have actionable information. The interventions that lower it — Zone 2 exercise, resistance training, time-restricted eating, sleep optimisation — are also the most broadly beneficial health investments a person can make. And because HOMA-IR responds rapidly to intervention, improvement is visible and measurable within weeks.
At your next blood draw, ask for fasting insulin. Calculate your HOMA-IR. Know your number. It may be the most important metabolic number you don't currently have.